(518) 480-7164
[email protected]
Facebook
X
Instagram
Facebook
X
Instagram
Blog/News
Custom Software Development
Business and IT Consulting
AI-ML-Driven Data Analytics
IT Talent Sourcing
Custom Web & Mobile Apps
About TIMIT
TIMIT Executive Team
TIMIT Process
TIMIT Customers
Blog
Contact TIMIT SOLUTIONS
Select Page
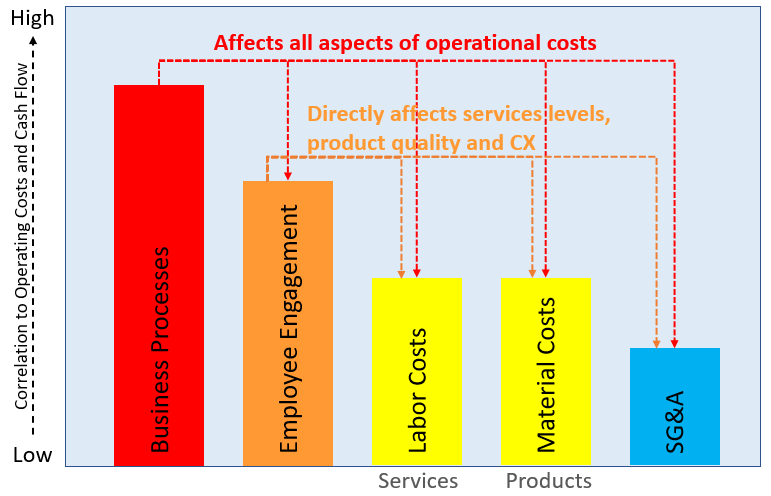
Pareto of Business Costs
TIMIT Solutions
PHONE
(518) 480-7164
E-MAIL
[email protected]